Azure SQL VM Performance Workbook
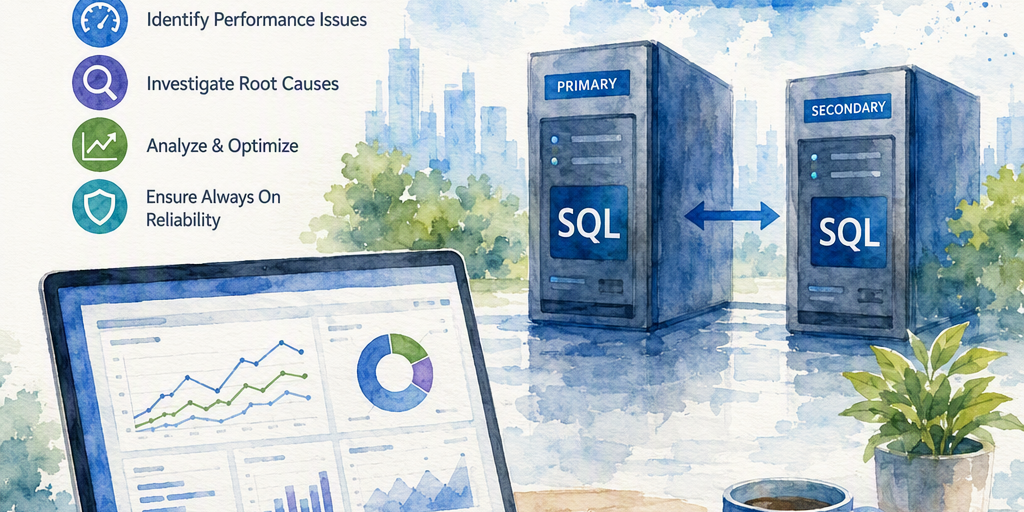
This workbook is designed for troubleshooting SQL Server Always On performance on Azure VMs, with priority on:
Purpose
Use this workbook to investigate performance and availability group behavior across SQL Server instances running on Azure virtual machines. Correlate multiple signals rather than treating a single metric as proof of root cause.
- Storage latency, queue depth, IOPS, and throughput
- CPU, memory, paging, and VM resource pressure
- Network quality between availability group replicas
- Availability group synchronization and transport health
- SQL Server waits, workload rates, and bottlenecks
- Failover duration and post-failover recovery
Prerequisites and Data Sources
- Azure Monitor access to the subscription, resource group, or VM resources being investigated.
- Log Analytics query permissions for the workspace used by the workbook.
- SQL Server permissions required by the selected SQL monitoring solution to collect waits, performance counters, and availability group state.
- Azure Monitor Agent, VM Insights, SQL Insights, an equivalent SQL monitoring solution, or another documented collection method.
- Known availability group topology, replica roles, databases, commit modes, recovery objectives, and workload baselines.
Data availability and collection latency vary by agent, table, workspace, and monitoring configuration. Validate table names, column names, units, sampling intervals, and retention before publishing workbook queries. The tables used in the examples below are illustrative and are not present in every Azure Monitor or SQL monitoring deployment.
Azure platform metrics may be available in AzureMetrics, VM Insights data may be available in InsightsMetrics, Windows performance counters may be available in Perf, and SQL Insights or a custom solution may use tables such as SqlInsights or custom tables. Availability group telemetry may be exposed through a SQL monitoring table, a custom log table, or direct SQL queries that are exported to Log Analytics. Replace the example table and column names with the schema documented for the deployed solution.
Scope and Configuration
Configure the workbook with a parameterized list of SQL VM computer names, for example SQLNODE01, SQLNODE02, and SQLNODE03. These names are examples only and must not be treated as required host names.
Use the workbook with:
- Azure Monitor platform metrics and VM Insights
- A Log Analytics workspace
- SQL Insights or another SQL Server monitoring solution
- SQL Server performance counters, wait statistics, and availability group health data
Workbook Layout
1. Overview
Place these charts on the first tab:
- VM percentage CPU by node
- Available memory and paging indicators by node
- Data and log disk read and write latency
- Disk IOPS and throughput compared with configured or observed limits
- Network ingress, egress, and dropped packets
- Availability group send queue, redo queue, and synchronization state
Use the workload baseline to identify sustained CPU saturation, unusual disk latency, queue growth, and packet-drop events. Compare the same time window with batch requests, transaction rates, commit mode, replica role, and workload volume.
2. Storage Bottleneck Analysis
Display:
- Read latency and write latency at the 50th, 95th, and 99th percentiles
- IOPS consumed compared with the applicable disk or VM limit
- Throughput consumed compared with the applicable disk or VM limit
- Read and write queue depth
- Separate data, log, and temporary database storage where possible
- Disk throttling, bursting, or credit metrics when exposed for the selected disk and VM configuration
High latency combined with high queue depth can indicate storage pressure, but it is not conclusive. Compare the observation with workload volume, disk-service limits, cache behavior, storage configuration, VM limits, and host-level metrics. High latency with low IOPS can indicate a short burst, throttling, backend saturation, or a measurement artifact.
Log write latency and WRITELOG waits can rise together when log I/O is constrained, but WRITELOG can also reflect transaction volume, log flush behavior, storage configuration, or other contributing factors. Confirm the relationship using workload and SQL Server evidence.
3. Compute and Memory Pressure
Display:
- Azure VM percentage CPU, including average and high-percentile values
- Available memory, paging, and SQL Server memory indicators
- Batch requests per second and transaction rate for workload context
- Host-level limitation or throttling metrics where Azure exposes them
- Burst-credit metrics for applicable burstable VM sizes
- Disk and network throttling indicators
A sustained CPU level above approximately 80 to 85 percent can be a useful investigation trigger, but it is only a starting point. Set alert levels from workload-specific baselines, CPU entitlement, query behavior, and observed user impact. Falling available memory with increasing paging or memory-related SQL waits supports a memory-pressure hypothesis; it does not identify the cause by itself.
4. Network and Replica Transport
Display:
- Network ingress and egress by node
- Packet drops, connection errors, and relevant latency measurements
- Availability group send queue and redo queue
- Replica synchronization health and database synchronization state
- Replica role and synchronous or asynchronous commit mode
A growing send queue can indicate network constraints, primary workload pressure, or secondary processing limitations. A growing redo queue often indicates secondary I/O or CPU pressure, but it can also reflect workload characteristics or recovery activity. Interpret queue size together with queue growth rate, log-generation rate, transport latency, replica role, and commit mode.
5. SQL Engine Health
Display charts and tables for:
- Top wait categories over time and by node
- Batch requests per second and transactions per second
- Compilations and recompilations
- Tempdb allocation, contention, and file-space indicators
- Log bytes flushed per second
- Active requests, blocking, and query duration where available
Useful wait categories include:
- PAGEIOLATCH
- WRITELOG
- CXPACKET and CXCONSUMER
- ASYNC_NETWORK_IO
- RESOURCE_SEMAPHORE
Normalize waits where possible by elapsed time, workload volume, or request count. Wait categories require SQL Server and application context before they are used to identify a root cause.
6. Failover and Recovery
Track the following around each failover window:
- Availability group role-change timestamp
- Failover duration from the documented start and completion events
- Post-failover stabilization duration
- CPU, disk latency, queue, network, and SQL wait changes
- Client connection errors and reconnect duration
- Replica role, database state, and synchronous or asynchronous commit mode
Define success using the documented high-availability recovery time objective, client reconnection objective, and an environment-specific stabilization baseline. A suitable criterion may include failover completion within the RTO, no continuing queue growth after stabilization, and client reconnect behavior within the application objective.
KQL Starter Queries and Schema Validation
The following queries are templates, not universal drop-in queries. Confirm the source table and fields in the target workspace with getschema, the Azure Monitor data reference, or the documentation for the installed SQL monitoring solution. If a table is unavailable, use the equivalent Azure platform metric, VM Insights metric, SQL Insights field, custom table, or direct SQL collection pipeline.
A. VM Performance Counters
This example assumes Windows performance data in Perf. Azure Monitor platform metrics may instead be available in AzureMetrics, and VM Insights data may be available in InsightsMetrics. Counter names and object names differ by agent and collection rule.
let Nodes = dynamic(["SQLNODE01", "SQLNODE02", "SQLNODE03"]); Perf | where TimeGenerated > ago(24h) | where Computer in~ (Nodes) | where ObjectName in~ ("Processor", "Memory", "LogicalDisk", "Network Interface") | summarize AvgValue = avg(CounterValue) by TimeBin = bin(TimeGenerated, 5m), Computer, ObjectName, CounterName, InstanceName | order by TimeBin ascB. Time-Based SQL Waits
This example assumes a SQL monitoring table named SqlInsights with the shown fields. It returns the top waits for each node and five-minute interval, rather than the top rows for the entire 24-hour period. If the source reports cumulative wait counters, calculate interval deltas before ranking the waits.
let Nodes = dynamic(["SQLNODE01", "SQLNODE02", "SQLNODE03"]); SqlInsights | where TimeGenerated > ago(24h) | where Computer in~ (Nodes) | summarize WaitMs = sum(todouble(WaitTimeMs)) by TimeBin = bin(TimeGenerated, 5m), Computer, WaitType | partition hint.strategy=native by Computer, TimeBin (top 15 by WaitMs desc) | order by TimeBin asc, Computer asc, WaitMs descC. Availability Group Health Snapshot
SqlAvailabilityReplica is an example name and is not a universal Azure Monitor table. The equivalent data may come from a custom SQL collection table or a direct SQL query that exports replica state. Confirm field names and whether queue values are reported in KB, bytes, or another unit.
let Nodes = dynamic(["SQLNODE01", "SQLNODE02", "SQLNODE03"]); SqlAvailabilityReplica | where TimeGenerated > ago(24h) | where Computer in~ (Nodes) | project TimeGenerated, Computer, ReplicaName, Role, SynchronizationHealth, SendQueueKb, RedoQueueKb, CommitMode | order by TimeGenerated descD. Disk Latency Trend
In the Windows Perf schema, Avg. Disk sec/Read and Avg. Disk sec/Write are commonly reported in seconds per operation. The query converts values to milliseconds. Counter availability, naming, and aggregation behavior depend on the collection agent. If the source already reports milliseconds, remove the conversion.
let Nodes = dynamic(["SQLNODE01", "SQLNODE02", "SQLNODE03"]); Perf | where TimeGenerated > ago(24h) | where Computer in~ (Nodes) | where ObjectName =~ "LogicalDisk" | where CounterName in~ ("Avg. Disk sec/Read", "Avg. Disk sec/Write") | extend LatencyMs = todouble(CounterValue) * 1000.0 | summarize P95LatencyMs = percentile(LatencyMs, 95), AvgLatencyMs = avg(LatencyMs) by TimeBin = bin(TimeGenerated, 5m), Computer, CounterName, InstanceName | order by TimeBin ascIf these counters are absent, use the corresponding Azure disk latency platform metrics or the latency fields collected by VM Insights. Validate whether the metric represents an individual operation, an interval average, or a pre-aggregated percentile before calculating additional percentiles.
Baseline and Alert Recommendations
Use the following as initial investigation triggers, then tune them against at least several representative peak and nonpeak periods:
- CPU above approximately 85 percent for 10 to 15 minutes, with workload or user-impact evidence.
- Disk read or write latency above the workload baseline for 10 minutes, with the unit explicitly defined. For example, an environment may begin investigation at a sustained p95 above 10 to 20 ms for data storage or a separately established log-storage baseline.
- Queue growth sustained across multiple collection intervals, such as a positive trend for 10 minutes, rather than a single high queue value.
- Packet drops above the established rate or count baseline during replica transport or commit pressure, confirmed across more than one interval.
- Replica synchronization state becoming unhealthy or a send or redo queue exceeding a documented operational limit.
- Failover duration or client reconnection time exceeding the documented HA RTO or application recovery objective.
- VM heartbeat loss, subject to confirmation of agent health and data-collection delay.
Thresholds must account for disk type, VM size, burst behavior, workload, replica commit mode, sampling interval, and known maintenance or backup activity.
Operational Runbook Integration
Account for ingestion and query latency before declaring an active condition. Confirm the time range, time zone, sampling interval, missing data, and last successful collection time.
- Open the Overview tab and confirm the incident window, affected nodes, replica roles, and data freshness.
- Check storage latency, queue depth, IOPS, throughput, disk limits, and throttling indicators. Separate data, log, and tempdb storage when possible.
- Validate availability group health, send and redo queue growth, database synchronization state, and synchronous or asynchronous commit mode.
- Review CPU, memory, paging, Azure VM limitations, burst credits where applicable, and network metrics.
- Review time-based SQL waits and workload rates. Correlate waits with queries, blocking, log generation, and storage observations.
- For failover events, compare role-change timestamps, failover duration, client errors, and post-failover stabilization with the documented objectives.
- Capture an evidence pack containing the incident window, data-source details, metric screenshots, top waits by interval and node, queue and latency trends, replica context, collection gaps, and root-cause and remediation notes.
Do not make production changes solely from one metric. Confirm the hypothesis with at least one workload signal, one platform or infrastructure signal, and one SQL or availability group signal when available.
Change Log
- v1.1 Added schema-validation guidance, alternative data sources, unit conversion, time-based wait ranking, configurable node examples, Azure-specific compute metrics, baselines, prerequisites, and operational cautions.
- v1.0 Initial workbook definition for SQL Server Always On performance troubleshooting on Azure VMs.
Summary
Practical guidance about Azure SQL VM Performance Workbook.