IIS CPU Spikes
If an IIS application pool hits 100% CPU and crashes the server, it usually means the worker process (w3wp.exe) has entered an infinite loop, a deadlock, or is thrashing due to memory pressure.
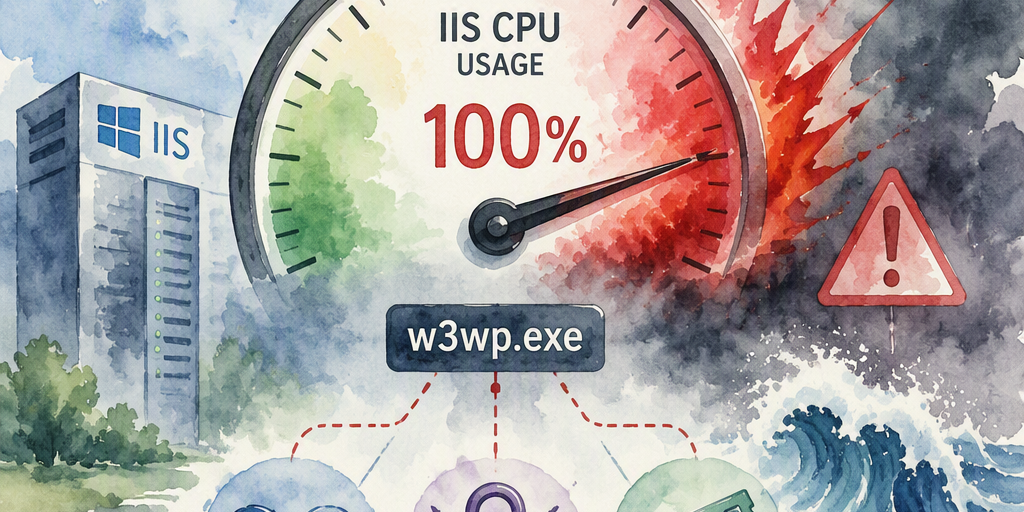
Sustained high CPU in an IIS application pool usually indicates runaway application code, excessive request processing, tight loops, inefficient database queries, or garbage-collection activity. A deadlock can cause requests to hang, but the affected threads are typically waiting, so a deadlock does not necessarily produce high CPU.
Use CPU controls to limit the impact of one application pool, then collect enough diagnostic data to identify and fix the underlying workload.
1. Configure the IIS CPU Limit Carefully
IIS exposes CPU settings in the application pool's Advanced Settings. These settings control how IIS responds when the worker process exceeds the configured CPU usage over a measurement interval.
- CPU Limit: The value is expressed in thousandths of a percent. For example, 80000 represents 80 percent.
- Limit Interval: The interval, in minutes, over which IIS evaluates CPU usage. A short interval can respond more quickly to bursts, while a longer interval smooths out transient activity.
- CPU Action: The available actions and their behavior depend on the IIS and Windows Server version. NoAction records the event without enforcing a process-level response. KillW3wp terminates the worker process when the limit is reached; IIS may start a replacement process, but this should not be treated as a guaranteed or graceful restart. A throttling option may limit CPU use without terminating the process where supported.
Confirm the available CPU actions and their behavior in the documentation for the installed IIS and Windows Server version. Test the limit under representative load before applying it to production. CPU controls reduce the blast radius of a spike but do not correct inefficient code, failed dependencies, or excessive traffic.
2. Investigate Memory and Garbage-Collection Activity
High CPU can accompany intensive garbage collection when a .NET application allocates heavily, retains too much memory, or approaches its available memory. It can also result from native memory usage, paging, or other resource pressure.
- Private Memory Limit (KB): Configure this only after reviewing the application's normal and peak private-byte usage. The appropriate value depends on server capacity, application architecture, worker-process bitness, the number of pools sharing the server, and the application's tolerance for recycling.
- Application behavior: Review allocation patterns, memory leaks, request sizes, caching, and dependency behavior. A private-memory limit causes IIS to recycle the pool after the limit is exceeded; it does not guarantee a graceful result or prevent a system-wide out-of-memory condition.
Use observed memory trends and capacity planning to choose a limit, and leave sufficient memory for the operating system, other worker processes, databases, and monitoring tools.
3. Use Rapid-Fail Protection for Repeated Failures
Rapid-Fail Protection is intended primarily to stop an application pool that repeatedly fails, such as when a worker process crashes several times within a configured period. It is not a general CPU-throttling mechanism.
- Failure Interval: The period in which IIS counts worker-process failures.
- Maximum Failures: The number of failures allowed during that interval before Rapid-Fail Protection takes action.
- Enabled: When the threshold is reached, IIS can disable the application pool to prevent a repeated crash cycle. The exact event and configuration behavior should be confirmed for the installed IIS version.
Use the CPU Action setting, rather than Rapid-Fail Protection, when the immediate requirement is to respond to sustained CPU consumption. Investigate the cause of any repeated failures before increasing the thresholds.
4. Collect Diagnostic Data During the Spike
Capture data while the worker process is consuming CPU whenever possible. A single snapshot may identify a likely hot path, while several samples taken over time help distinguish a tight loop from normal request processing, contention, or changing traffic patterns.
- Performance Monitor: Log Process\% Processor Time for the relevant w3wp instances, along with request-rate, queue-length, memory, paging, and application-specific counters where available. Map each worker-process instance to its application pool because instance names can change after a recycle.
- DebugDiag: Use the performance or CPU-related rule available in the installed DebugDiag version to collect one or more dumps when the configured CPU condition is met. Thresholds such as 90 percent for 30 seconds are examples, not universal defaults; verify the rule's supported counters, thresholds, and dump type before deployment.
- Dump analysis: A dump can reveal active call stacks, thread states, contention, and likely hot paths. It does not automatically identify the exact source line responsible for a loop. Correlate dump results with source code, request traces, logs, database metrics, and deployment history.
Capture multiple dumps at short intervals when safe to do so, and account for the disk space and performance impact of dump collection.
5. Base Recycling on Evidence
Recycling can release memory and reset a process, but it can also interrupt requests, increase startup load, discard in-process state, and conceal an underlying leak or performance defect. A scheduled nightly recycle should not be treated as a universal remedy.
- Recycle conditions: Configure time-, request-, memory-, or schedule-based recycling only when monitoring data and the application's operational requirements justify the condition.
- Scheduled recycling: If a scheduled recycle is necessary, choose a low-traffic period, account for graceful-shutdown and warm-up behavior, and confirm that session state, caches, and background work are handled correctly.
- Recycle event logging: Enable logging for the recycle reasons that matter to the investigation, such as scheduled, configuration-change, memory-based, request-based, or on-demand recycling. Do not enable every option by default; verify the resulting IIS/WAS event records in the appropriate Windows event log.
Use CPU limits, memory limits, and recycling as containment measures while addressing the underlying application, dependency, traffic, or infrastructure problem.
Summary
Practical guidance about IIS CPU Spikes.