Web Server Performance
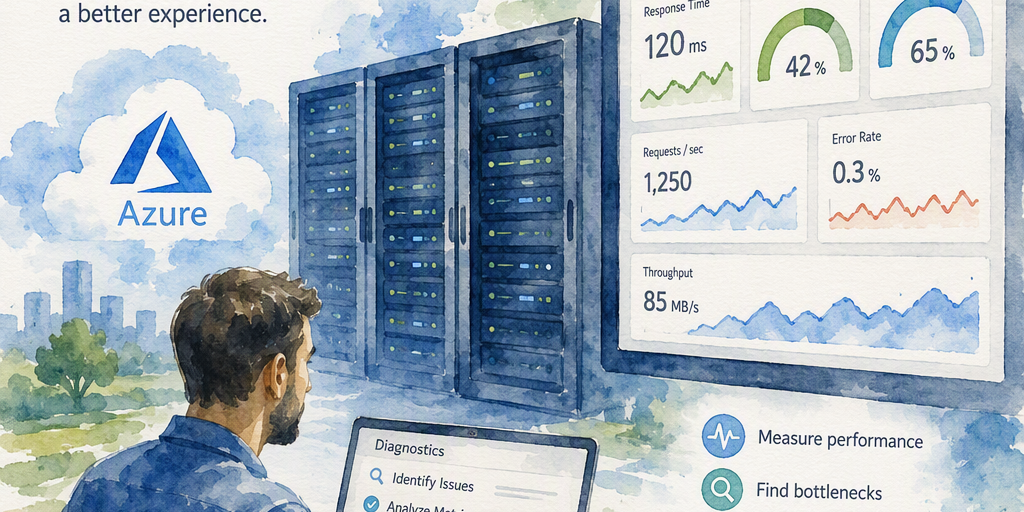
Use this guide to diagnose poor performance on web servers running on Azure VMs or similar infrastructure.
Purpose
Use this guide to identify whether poor web server performance originates in the VM, guest operating system, application, database, network path, or another dependency. The examples focus on Azure VMs, but the investigation method also applies to similar infrastructure.
Initial Triage
Begin with the fastest indicators of saturation and correlate them with user impact:
- Application response time, request rate, queue length, and error rate
- CPU utilization and processor run-queue behavior
- Memory availability, paging, and process or worker utilization
- Disk latency, throughput, I/O operations, and queue depth
- Network throughput, connection behavior, retransmissions, and packet drops
First establish whether the issue is constant, occurs only during traffic peaks, affects all requests, or is limited to particular endpoints or tenants. Compare the affected period with a healthy baseline that uses the same time zone, traffic pattern, deployment version, and dependency configuration where possible.
Common Symptoms
- Slow page loads or increased time to first byte
- Request timeouts
- Spiky or steadily increasing response times
- Intermittent HTTP 5xx errors
- Long web server or application queue times
- Good performance at low load followed by degradation during traffic peaks
Fast Triage Procedure
- Record the start and end times, affected URLs, request volume, status codes, and observed latency.
- Check Azure platform metrics for the VM, disks, network interfaces, and any load-balancing services.
- Check guest operating system counters for memory pressure, paging, processor queues, process-level CPU, and disk queues. These counters normally require Azure Monitor Agent and a data collection rule or another guest monitoring solution.
- Check disk read and write latency separately for the operating system, application data, database, and log volumes.
- Check network throughput and connection behavior. Use Network Watcher, guest monitoring, packet capture, flow logs, or application telemetry when platform metrics do not provide the required detail.
- Correlate the infrastructure timeline with application logs, IIS or other web server logs, reverse proxy logs, database telemetry, dependency traces, and deployment events.
Metric Sources and Limitations
Azure Monitor platform metrics and guest operating system metrics are different data sources. Platform metrics are collected from Azure resources, while guest metrics describe activity inside the VM and require an agent or other instrumentation. Metric names and availability can vary by resource type, operating system, agent configuration, and Azure service.
Do not assume that every metric listed in this guide is available as a standard Azure platform metric. Confirm availability in the resource's Metrics blade, the Azure Monitor documentation, or the configured data collection rule before relying on a metric.
Azure VM Metrics to Inspect
Platform and Compute
- Percentage CPU is commonly available as an Azure VM platform metric.
- Compare CPU with request latency, request rate, queue length, and duration. A high value is not by itself proof of CPU saturation.
- Available Memory Bytes and Processor Queue Length are generally guest operating system counters rather than universal Azure platform metrics. Collect them with Azure Monitor Agent, VM Insights, or another supported monitoring solution.
- Use process-level CPU and worker-process metrics when one application, IIS worker process, or background task may be responsible for the load.
Disk
- Review platform disk metrics such as read and write operations, read and write bytes, and throttling where exposed for the disk or VM.
- Review guest counters such as Avg. Disk sec/Read, Avg. Disk sec/Write, and Current Disk Queue Length when they are collected.
- Separate OS, application, database, temporary, and log volumes in the analysis. A high average can hide a problem affecting only one volume.
- Compare observed IOPS and throughput with the limits of the managed disk SKU, VM size, caching mode, and workload.
Network
- Review platform metrics such as network bytes in and out for the VM or network interface.
- Bytes Sent/sec, Bytes Received/sec, TCP retransmissions, and some packet-drop indicators generally require guest monitoring, Network Watcher, packet capture, flow logs, or application-specific instrumentation.
- Check connection counts, connection establishment time, DNS latency, TLS negotiation time, and downstream call latency when the application reports slow responses but VM resource metrics appear normal.
Application and Dependency Checks
- Review application logs and distributed traces for timeouts, retries, dependency failures, and unusually slow endpoints.
- Check IIS request queue length and worker-process behavior for IIS workloads. Use equivalent queue and worker metrics for other web servers.
- Review reverse proxy, load balancer, and health probe status.
- Measure request latency by route and dependency rather than relying only on an overall average.
- Check database CPU, storage latency, lock waits, query duration, connection limits, and throttling. A web server can appear busy while requests are actually waiting on a database.
- Check external HTTP services, caches, DNS, identity providers, storage services, and message brokers for latency or throttling.
Connection Pool Exhaustion
Connection pool exhaustion can cause latency spikes, intermittent timeout errors, and failures when opening database or HTTP connections.
- Compare active connections with the configured maximum pool size during the affected period.
- Measure connection acquisition wait time and timeout counts.
- Confirm that connections are returned promptly on both success and error paths. Missing close or dispose operations can create leaks.
- Check whether long-running queries or downstream calls hold pooled connections longer than expected.
- Increase pool size only after confirming that the database or downstream service can accept the additional concurrency. A larger pool can move the bottleneck and increase database contention.
- Use retries with backoff only for failures known to be transient. Bound retries, avoid retry storms, and do not retry non-idempotent operations without an appropriate design.
Distinguishing Likely Bottleneck Layers
CPU-Bound Workload
Possible indicators include sustained CPU utilization above the workload's normal baseline, increasing processor queues, and response time or request queues rising with traffic while disk and network behavior remain healthy. No universal CPU percentage proves saturation; evaluate utilization together with latency, queue length, throughput, and duration.
Possible actions include reducing background work, optimizing expensive code, adding caching, resizing the VM, or scaling out. Validate each change against the same request mix and monitor for a new memory, database, or dependency bottleneck.
Memory-Bound Workload
Possible indicators include declining available memory, increased paging or swapping, garbage-collection pressure, process restarts, and slower responses during sustained load.
Possible actions include correcting leaks, reducing process or worker counts, tuning application memory use, and selecting a VM with more memory. Confirm that the observed pressure is in the guest and identify the process consuming memory before resizing.
Disk-Bound Workload
Possible indicators include increased read or write latency, growing guest disk queues, throttling, and throughput that repeatedly reaches a disk or VM limit.
Possible actions include moving to a suitable managed disk SKU, separating OS, data, and log workloads, or changing the storage layout. Disk striping or multiple disks can increase aggregate throughput but adds configuration, operational, and failure-domain complexity. Use it only when the workload and supported storage design justify it, and validate throughput, latency, recovery, and backup behavior.
Change disk caching only after reviewing the workload and Azure disk guidance. Read and write caching can affect latency, consistency, durability, and database safety. Follow the recommendations for the specific disk type and application before changing the setting.
Network-Bound Workload
Possible indicators include slow responses while CPU and disk remain within baseline, increased retransmissions or packet drops, connection establishment delays, or throughput approaching a documented VM, NIC, service, or path limit.
Possible actions include removing an unintended proxy or firewall bottleneck, reviewing routes and security devices, addressing SNAT port exhaustion, or selecting a VM size with a higher network limit. Confirm the bottleneck with connection, flow, and throughput data before changing the topology.
Azure-Specific Checks
- Compare observed disk and network throughput with the documented limits for the VM size, managed disk SKU, NIC, and relevant Azure service.
- Check whether Accelerated Networking is supported for the selected VM size, operating system, region, and deployment configuration. Follow the current Azure Accelerated Networking documentation before enabling or changing it.
- Enabling Accelerated Networking can require supported guest drivers, VM deallocation or other configuration steps, and a maintenance window. Confirm that the NIC is the limiting component, record the current configuration, test the change in a representative environment, and validate application latency and connectivity afterward.
- Review effective routes if traffic appears to pass through a firewall, network virtual appliance, proxy, or other inspection point.
- Use Network Watcher connection troubleshoot, topology, flow logs, and packet capture as appropriate. Collection and retention settings can have cost and privacy implications.
- Check whether a load balancer or Application Gateway is limiting throughput, adding latency, rejecting requests, or reporting unhealthy backends.
Load Balancer Considerations
- Confirm that the backend pool is healthy and that probes test a meaningful dependency without creating excessive application load.
- Review probe interval, timeout, and success or failure thresholds. More aggressive settings can remove healthy instances during short-lived latency spikes; less aggressive settings can leave failed instances in rotation.
- Check whether session affinity is required. Affinity can create uneven load distribution and hide capacity problems on individual instances.
- Confirm that the selected load balancer SKU and configuration support the required scale, availability, observability, and traffic pattern. Review current Azure service limits and pricing before changing SKUs.
- Investigate SNAT exhaustion when outbound connections from instances fail or slow while inbound health remains normal. Reduce unnecessary outbound connection churn, use connection reuse, or select an appropriate outbound design only after confirming the port-allocation behavior.
Application Gateway Considerations
- Review backend response time, total request duration, connection errors, and 4xx and 5xx trends separately.
- Check request timeout settings against the legitimate duration of backend operations. Increasing a timeout can reduce premature failures but can also retain connections longer, increase resource use, and hide an application or dependency problem.
- Review WAF logs for blocked requests and false positives. Tune rules narrowly, test changes safely, and retain appropriate protection for malicious traffic.
- Confirm that TLS termination, certificate processing, protocol negotiation, or re-encryption is not adding unexpected latency. Compare frontend and backend timing where telemetry supports it.
- Validate health probe host, path, status codes, timeout, and interval. A probe that does not represent real backend readiness can route traffic incorrectly.
Use the Application Gateway documentation and the relevant Azure Load Balancer documentation for service limits and configuration behavior before making changes.
Tools and Evidence Sources
- Azure Monitor Metrics: platform resource metrics for VMs, disks, network interfaces, load balancers, and Application Gateway.
- Azure Monitor Agent and VM Insights: guest operating system, process, performance, and dependency telemetry when configured.
- Log Analytics and Kusto queries: correlation of infrastructure, guest, application, and service logs.
- Application Insights or another APM tool: request timing, distributed traces, dependency duration, exceptions, and availability tests.
- Network Watcher: connection troubleshooting, topology, flow logs, and packet capture where supported and appropriate.
- Web server and operating system tools: IIS logs, access logs, performance counters, event logs, process details, and operating system resource monitors.
Minimum Evidence Pack
Capture the following before changing configuration:
- Issue start and end times, time zone, affected instances, URLs, tenants, and request types
- Traffic volume, concurrency, response-time percentiles, queue lengths, and error rates
- Azure platform charts for CPU, disks, network, load balancers, and Application Gateway where applicable
- Guest CPU, memory, paging, process, disk queue, retransmission, and connection data when available
- Application, web server, database, dependency, health probe, and platform logs
- VM size, operating system, disk SKU and caching configuration, NIC features, routes, and network security configuration
- Recent deployments, configuration changes, scaling events, and dependency incidents
Recommended Fix Order
- Establish a baseline and identify the affected request path.
- Determine whether the bottleneck is in the VM, guest OS, application, database, network path, or downstream dependency.
- Remove confirmed saturation or misconfiguration with the smallest safe change.
- Tune the application or dependency before adding capacity when the evidence supports optimization.
- Scale the constrained resource or change the service configuration after checking limits, cost, availability, and operational impact.
- Re-test with the same representative load and compare latency, throughput, errors, and resource behavior with the baseline.
- Document the change, rollback plan, and resulting capacity margin.
Notes
- High CPU does not always indicate a compute bottleneck. A blocked dependency, excessive retries, or inefficient request handling can produce the same symptom.
- Normal network throughput does not rule out network latency, connection limits, DNS delays, SNAT exhaustion, or a bottleneck in a proxy or firewall.
- Do not infer a disk problem from high I/O alone. Check latency, queue depth, throttling, workload type, and the applicable storage limits.
- Use workload baselines rather than universal thresholds. Sustained resource pressure combined with worsening latency or queues is more significant than a brief utilization spike.
- Make one material change at a time when possible, monitor the result, and retain a tested rollback path.
Summary
Practical guidance about Web Server Performance.